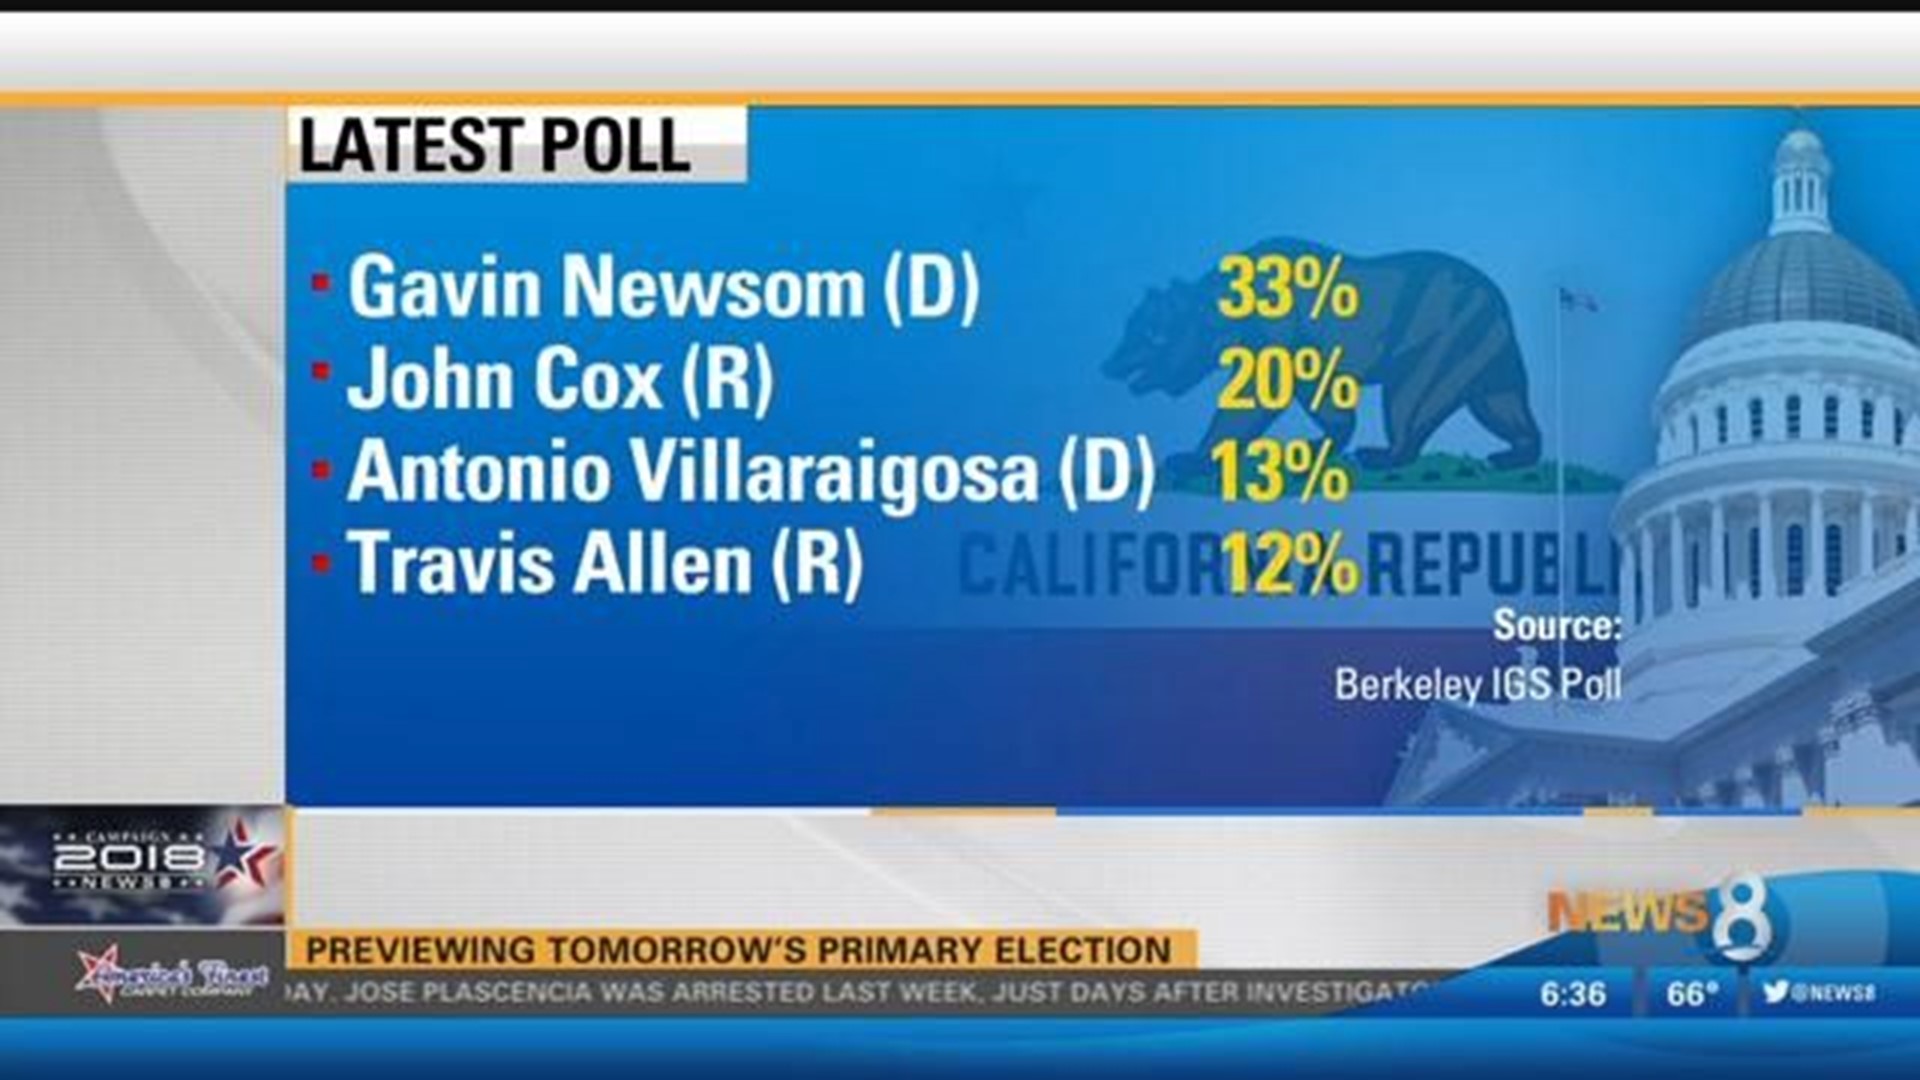
SAN DIEGO (NEWS 8) - More than 19 million Californians are registered to vote ahead of the state's Tuesday primary. That's more than three-quarters of the eligible voter population.
San Diego voters by the numbers:
For the June 5, 2018 Gubernatorial Primary Election, voter turnout is expected to be 40% to 45%.
Past historical turnout for primary elections include:
- • June 7, 2016 Presidential Primary - 51%
- • June 3, 2014 Gubernatorial Primary - 27%
- • June 5, 2012 Presidential Primary - 37%
- • June 8, 2010 Gubernatorial Primary - 38%
As of the closing date to register to vote, the number of voters in San Diego County is 1,693,774. There are 617,701 registered Democrats, 492,681 registered Republicans, 498,989 non-partisan registered voters and 84,223 registered as other.
The San Diego Registrar of voters as of June 4, 2018 issued over 1.1 million mail ballots. Of those mail ballots, 268,709 have been returned. As of June 3, 2018, 2,498 voters have already cast their ballots during early voting. Over 27,000 ballots have been dropped-off at the Registrar of Voters as of June 4, 2018.
At the polls:
- • 1444 precincts
- • 1264 physical poll locations
- • Approximately 6300 poll workers
New data released by the secretary of state last Friday shows voters with no party preference represent 25.5 percent of registered voters while Republicans make up 25.1 percent. Democrats remain the largest group at more than 44 percent.
RELATED

