


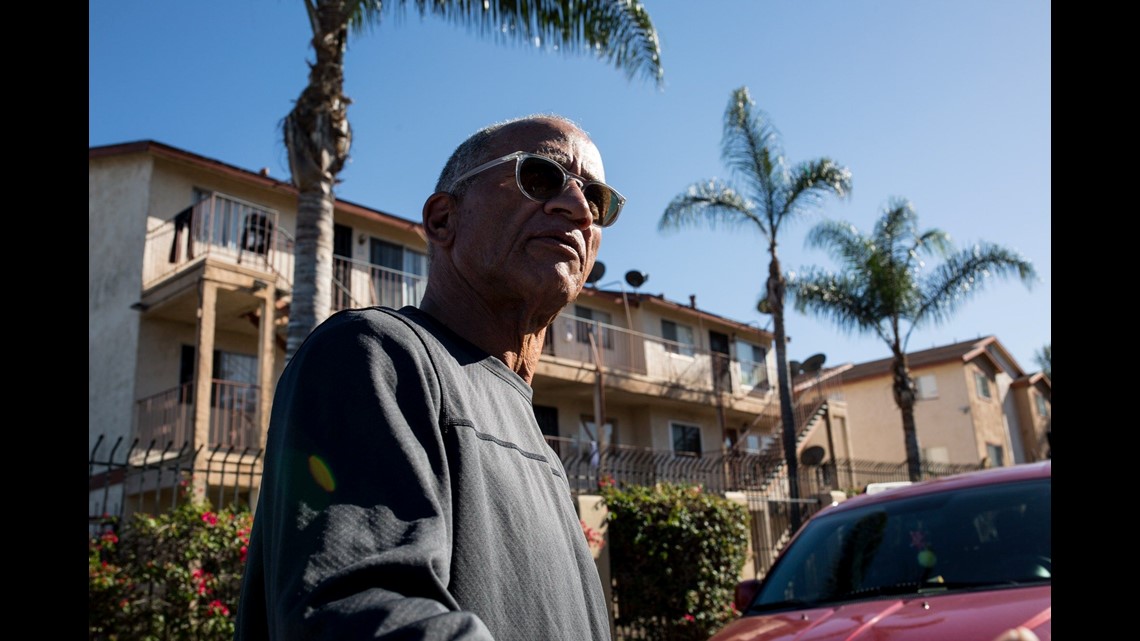
Brian Pollard with the Urban Collaborative Project, a San Diego nonprofit, walks around a southeastern San Diego community where he says new residents have made once primarily African-American areas more diverse. (Megan Wood, inewsource)

By Leonardo Castañeda | inewsource
When two residents in the southeastern San Diego neighborhood of Encanto meet, there’s a 71 percent chance they’re of different racial and ethnic backgrounds. In the coastal community of Cardiff, there’s only a 25 percent chance of that happening.
That makes Encanto one of the most diverse neighborhoods in San Diego County, and Cardiff one of the least diverse. Those findings are based on an inewsource analysis of ZIP codes with at least 10,000 residents.
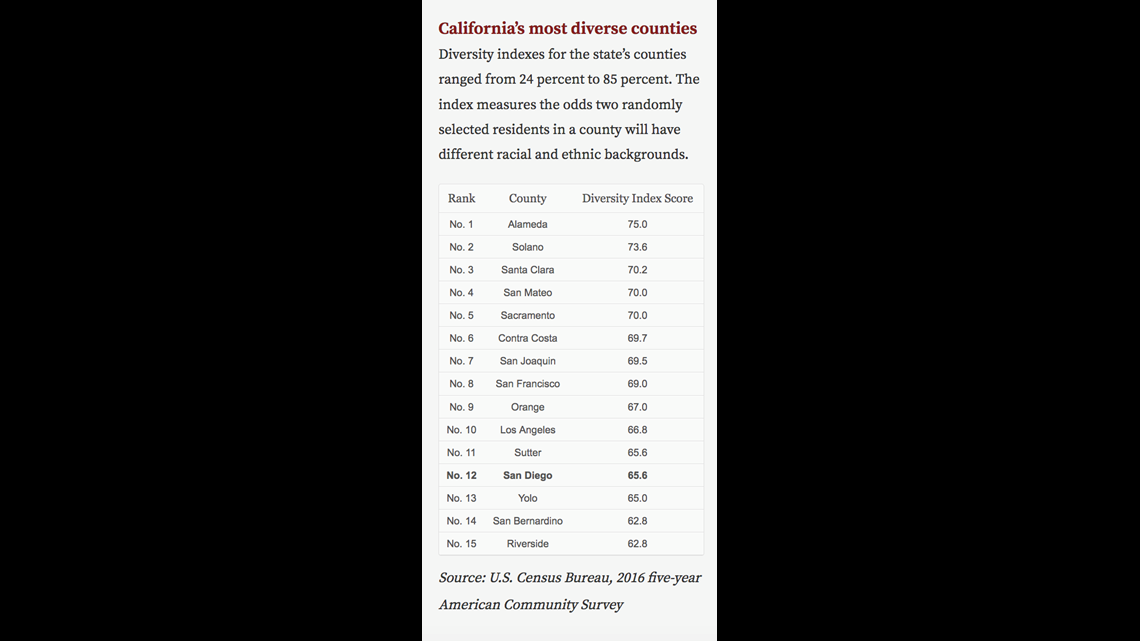
The diversity index was calculated using the 2016 five-year American Community Survey from the Census Bureau. A higher index number indicates a more diverse neighborhood, where the odds are higher of two random residents having different racial and ethnic backgrounds.
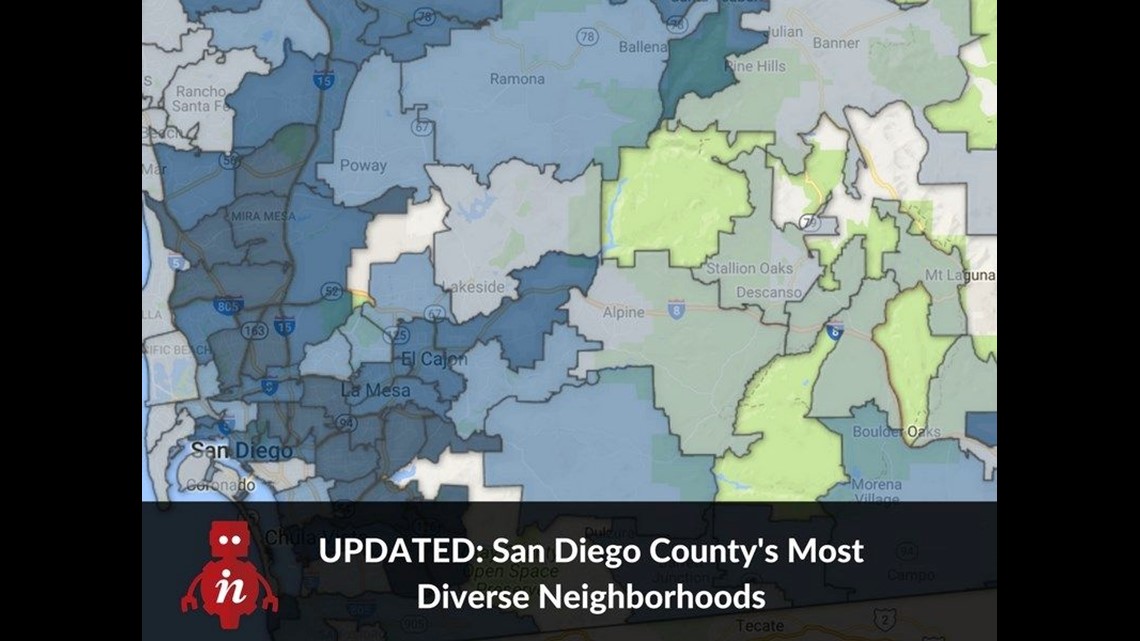
Explore this interactive map to find the diversity index for your ZIP code.
That doesn’t surprise Brian Pollard, chief executive of The Urban Collaborative Project, a nonprofit focused in part on health and safety issues in southeastern San Diego. He also sees the diversity as a positive.
“The diversity that I experience is a very healthy one,” Pollard said. “You can see the art that's appearing all over Southeast San Diego now. It depicts the cultures, it depicts a lot of history and a lot of looking forward.”
In other San Diego ZIP codes, including in the Rolando, Talmadge and Paradise Hills neighborhoods, the diversity index is 72 percent – higher than San Diego County’s overall index of 66 percent.
Other ZIP codes with diversity higher than the county’s include parts of eastern Chula Vista and the San Diego neighborhoods of Linda Vista, Serra Mesa and Mira Mesa. All have diversity indexes of about 70 percent.
Coastal communities such as La Jolla, Del Mar and Point Loma were less diverse than the total county. ZIP codes from Carlsbad to Point Loma ranged from 25 percent to 45 percent.
John Weeks, director of the International Population Center at San Diego State University, said the index results reflect historic migration patterns and housing costs.
At one time, Weeks said, housing laws made it legal to exclude non-whites from buying homes in certain neighborhoods, particularly coastal communities.

“You have a built in, historic almost, lack of diversity along the coast. But these days, mainly it's price,” Weeks said. “That's what keeps you out, if you don't have the money. And the people who are most likely to have the money, still in this country, tend to be non-Hispanic whites.”
At the same time, more affordable neighborhoods in southern and eastern San Diego have always had high levels of diversity, he said.
“Even if there were no social discrimination, the price discrimination kind of forces these housing patterns that we're seeing,” Weeks said.
Pollard said that southeastern San Diego continues to be attractive to new residents. Those neighborhoods have been relatively diverse but with a sizeable African-American population, he said. Now, those communities are becoming even more diverse, and African-Americans have become a smaller slice of the population.
“We really have to be open to diversity, which could not necessarily work in other parts of the city,” he said. “It works over here better because it's more of a shift. We've been living together for a while.”
There can still be mistrust among different cultural groups, Pollard said. But he has been trying to bridge those gaps, sometimes by hosting events such as cookouts with hotdogs or a community potluck.
“Sooner or later, then what you're going to start having is an organized community,” he said. “They're going to know each other, and they have to have some sort of trust, because they all live over here.”
Although often associated with minorities, diversity is a more nuanced concept. For example, San Ysidro along the border has the lowest diversity index in the county at 10 percent, with a population that is 95 percent Hispanic.
Similarly, Chula Vista neighborhoods roughly east of Interstate 805, such as Otay Ranch and Eastlake, are significantly more diverse than their more heavily Hispanic neighbors to the west, thanks to larger African-American and Asian populations.
Weeks said he expects the demographics of those communities to change as later generations of Hispanic immigrants become assimilated.
“Recent immigrants from Mexico are much more likely to identify themselves as being of Mexican origin,” he said. “But by about the third generation, that is gone.”
The diversity index used by inewsource doesn’t look for a high share of a specific racial or ethnic group. Instead, it checks for how evenly distributed a population is among the race and ethnicity groups used by the Census.
********
********
inewsource is an independent, investigative journalism nonprofit supported by foundations, philanthropists and viewers like you.
********
Read additional stories on the inewsource.org website.