
SAN DIEGO — In the very early days of the COVID-19 pandemic, News 8's Marcella Lee shared this interesting illustration from Visual Capitalist showing the history of pandemics and the number of lives lost.
Now, 18 months later, we wanted to see how COVID-19 has changed in size and scale.
Let's start by taking a look back at the original story from March 2020:
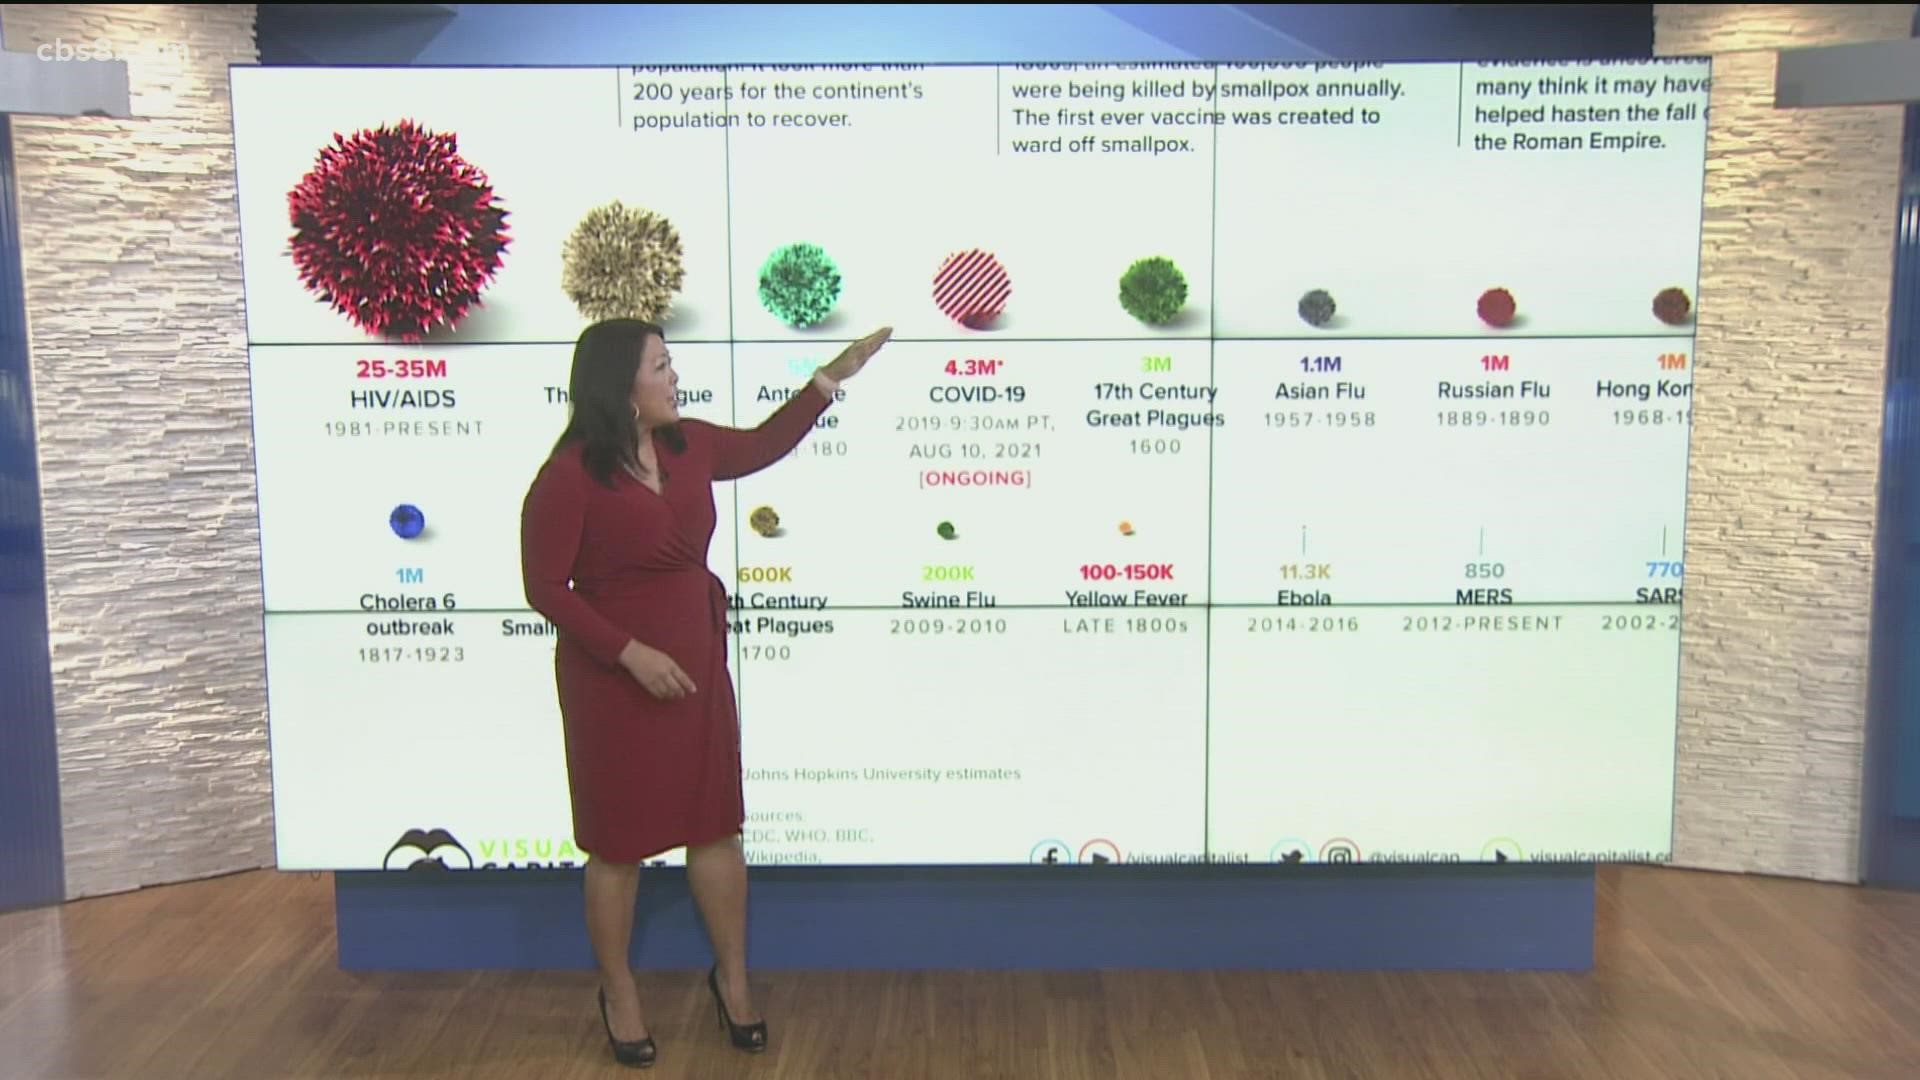
The number of deaths are shown on a timeline from the year 165 AD through the centuries. The Black Death or Bubonic Plague in the 14th century is the largest in terms of deaths; Smallpox comes next. On the graphic, the larger the virus icon, the more deadly. The Spanish Flu is next. And of course, in 2021, we are still dealing with COVID-19.
The same graphic from March 18, 2020, showed nearly 9,000 COVID-19 -related deaths. At the time, that was less than Ebola, Swine Flu, Hong Kong and Asian Flu. It was just one week after COVID-19 was officially declared a pandemic.
On the updated graphic from Visual Capitalist, you can see how much COVID has grown - from 9,000 deaths to 4.5 million lives lost to COVID-19, which is more than Ebola, Swine Flu, Hong Kong and Asian Flu.
In terms of the death toll from highest to lowest: the Bubonic Plague, which was spread by fleas, killed 200 million people in the 1300s; Smallpox in the 1500s killed an estimated 56 million people, the majority children.
In comparison from March 2020, COVID has moved significantly up the timeline, just a few spots down from HIV/AIDS which has killed 25 to 35 million people.
In the most recent illustration from Visual Capitalist, COVID-19 is represented with lines going thru the virus icon, because the death toll is still growing relatively quickly.